Download Jurnal PPDB hari ke-1 (30-06-2010), KLIK DI SINI
Download Jurnal PPDB hari ke-2 (01-07-2010), KLIK DI SINI

30 June 2010
[Sustainability College] At the Forefront of Sustainable Development Assistance to Foster Human Resources
[Sustainability College] At the Forefront of Sustainable Development Assistance to Foster Human Resources
 Copyright JFS Lecturer: Yojiro Ishii, Deputy Director General, and Group Director for Health Systems and Reproductive Health, Human Development Department, Japan International Cooperation Agency
"Sustainable Development Assistance" does not mean that development assistance should be continued indefinitely. In fact, sustainable development assistance is considered to be successful when it ends. The most important aspect of this approach is the support of self-sustaining development in order to allow developing countries to continue social development by themselves. First, I would like to talk about the types of assistance that are necessary, focusing particularly on people.
Development Assistance to the Health Sector
Total development assistance funding for health-related fields is estimated to be about two trillion yen worldwide, as of 2007. This has ballooned about by four times when compared to 1990 levels. Assistance funds have thus increased substantially when compared with other fields. Where do those funds come from?
Bilateral assistance accounts for one third of the total funds, with the United States being the major contributor. Particularly since September 11, 2001, the Bush Administration substantially increased assistance funding in an effort to improve national security, spending massive amounts on measures against HIV/AIDS and Malaria.
Funding by NGOs has also grown, and such funding plays an increasingly large role. For example, the Bill and Melinda Gates Foundation has been expanding since around 2000, and this trend has sparked participation by private financial groups, with the health sector gaining additional funds from them.
In the 1990's, Japan was the largest Official Development Assistance (ODA) donor. However, ODA funds have continued to decrease since 1997 due to the country's economic situation, and Japan is now fifth in the world.
Through free financial aid or technical aid provided via bilateral cooperation, funding by Japan supports the building of hospitals and healthcare centers, and the creation of infrastructure to deliver vaccines using refrigerated vehicles in order to preserve quality. ODA can also be offered to international organizations, such as UNICEF. Japan has contributed to the Global Fund to Fight AIDS, Tuberculosis and Malaria, which was established for the G8 Kyushu-Okinawa Summit in 2000, and Japan is a major donor, accounting for 7 to 8 percent of the total fund of two trillion yen.
Looking at regional allocations for ODA, Asia was mostly targeted in 1970's. In 1981, when I joined the Japan International Cooperation Agency (JICA), three quarters of the funds were for Asia; however, the ratio has gradually decreased, reaching 28 percent in 2007. In contrast, the funding ratio for Africa has increased markedly since 2000. At the fourth Tokyo International Conference on African Development , which was held in Yokohama in 2008, Japan promised to double its support for Africa, and although the total amount of ODA is decreasing, the shift in spending ratios will continue.
Assistance to Target People instead of Countries
One of the necessary elements for us to conduct assistance is human security. This is a concept that Sadako Ogata, the president of JICA, developed at the United Nations with Amartya Sen, who won a Nobel Prize for Economics.
Under the East-West Cold War structure after World War II, the assistance system for developing countries was mainly used to bring countries onto the respective sides. However, when this structure fell apart, the meaning of assistance changed radically. People began studying the ways in which assistance could be use to create societies where people could live in safety. It is important to ensure that assistance is delivered to the people.
There are two approaches to ensuring human security: the idea of protection, in which we help people who are "lying down"; and the idea of empowerment, in which we support the efforts of people who are trying to "stand up." The concept of human security tries to support communities and individuals through these approaches. When building a business framework, this notion is at the forefront of our thinking.
I would now like to introduce concrete examples of this concept. Over a period of 15 years, JICA expanded a project in an illegal residency district around Lusaka, the capital city of Zambia, called the Primary Health Care Project, which involved community-based activities to improve maternal and child health.
Many cities in Africa have such illegal residency districts, which were created by population flowing in from the countryside. The general level of social awareness within the community tends to be very low. Together with a regional counterpart, we considered the ways in which we could improve the residents' environment, and the first thing we aimed to provide was safe water. We installed a water tower and set up a site for water collection for each small group, and then let the community residents manage them.
In order to manage the water facilities, fuel is needed to operate pumps and chemicals are necessary to keep the water clean. We required the residents to build a water management system incorporating a method to procure the necessary commodities. This encouraged organization among the residents, and they subsequently devised further means to improve various other elements of their living environment.
For example, the residents had long dumped their garbage anywhere, but they later organized garbage collections, and now discard their garbage at a community site, while other local people cooperate to keep the roadside ditches clean. They also built a clean public bathroom next to the market, for use by people who come to the market, while a shower room was built for people who travel from longer distances, and the fees collected for its use then support other community activities.
What the residents needed most, in addition to these activities, was an improvement in maternal and child health. This required governmental intervention. However, the government does not manage all aspects of community health; instead, health volunteers are recruited from among the residents, which further empowers the residents themselves. The combination of government support and resident activities create sustainable local health activities, and this can help to realize human security within the community.
Differences in Assistance between Africa and Asia
As illustrated in the example of JICA's health business in Zambia, we believe that the health of women and children is the key. You may wonder about the men, but experience has shown that when the health of women and children improves, the overall health of men improves later. At present in Africa and South Asia, improving the health of women and children, and prolonging their lives by preventing infectious diseases are necessary.
In contrast, in Southeast Asia and Oceania, no infectious diseases are responsible for major health problems, but adult onset diseases are a more serious problem. Particularly in China, the population is aging rapidly, in part because of the one-child policy. Thus, health measures unique to the needs of an aging country with a population of 1.3 billion are needed. We therefore need to change our goals and devise new ways to support populations depending on societal development.
Another issue is the fostering and securing of human health resources as an international health issue. More people are coming to Japan as nurses or care workers from Indonesia or the Philippines. Although many of the doctors or nurses in Africa have moved to Europe or America, and the Japanese have never considered this to be our problem. However, this movement is now happening between Japan and other Asian countries.
If Japan benefits through these cross-border movements of the human health resources, other countries need to have such resources replaced. More and more people are obtaining medical care in developing countries at lower costs and medical tourism, in which patients go to developed countries to obtain higher levels of healthcare, is increasing. In Asia, where there are stronger ties between countries, new solutions that differ from those used in Africa are necessary. We are currently exploring such solutions, and as this issue is directly related to our health, we are also working to raise awareness among Japanese.
Five S's in Development Assistance
One of our tools to improve companies is the "Five S's", which are concepts of comprehensive quality management, including office environmental improvements: "Seiri" (Sort out), "Seiton" (Set/Organize), "Seisou" (Shine/Cleanliness), "Seiketsu" (Standardize), and "Shitsuke" (Sustain/Discipline). This idea has been introduced to domestic car manufacturers, such as Toyota, and is now achieving the desired effects. To enhance safety and efficiency, the five S's were introduced to the Japanese medical sector in the 1990's. Because the five S's were devised in both Japanese and English, they are now being used in fields related to development assistance.
For example, management of patient medical records is often poor in developing countries, and in many cases, medical staff simply write records and store them without a clear organization system. If such records are properly organized, the quality of medical care increases dramatically, as repeated examinations of the same patients are prevented when different doctors can consult well-kept patient records. In addition, when pharmacies are properly organized, the staff can keep track of which medicines are out of stock and need to be refilled. Although such organization is often taken for granted in the developed world, nations lacking this basic level of infrastructure cannot efficiently make use of the trillions of yen in funding. Our staff is currently traveling around 15 countries in Africa to teach the five S's concept.
Japanese Assistance Called Catalytic Support
Methods of assistance vary among countries. For example, the US does not apparently trust governments in developing countries, and as a result, they typically set up cooperative structures through local NGOs. On the other hand, European countries tend to provide greater support to the financial sectors of the central government, conducting top-level assistance to provide funding, and leaving the operational management to the recipient countries.
Japanese assistance focuses on cooperation from the top (central government) to the grassroots (community) level. We call this "catalytic support" and we provide support specific to the target field.
As support for the central government, the creation of systems or improving the capabilities of people who formulate national policies is very important. However, the people who deliver support to residents are field administrators and medical staff. Therefore, we also have to improve the capabilities of these people. Providing assistance unique to local needs in the field, such as the project in Zambia or promotion of the five S's, is the strong point of the Japanese approach. In this way, working with various support systems at both the national and community levels is the Japanese approach to global cooperation.
When students who are concerned about such activities ask about what they should do now, I like to ask them to look at what is happening in society, starting with Japan. It is also a good idea to go out to the field, and to take advantage of opportunities for fieldwork with international organizations, including JICA. I hope that I am able to encourage the development of human resources who will be active in the international community. Development assistance can therefore lead to Japanese people making greater contributions to the world.
Profile
After graduating from university, Yojiro Ishii began working at JICA. He engaged in project implementation of ODA businesses centering on the healthcare field over a period of about 30 years. He transferred to Pakistan and Bangladesh for a total of seven years and participated in business management of the assistance fields, negotiating with other countries and assistance planning. He is now aiming to expand cooperation among global health businesses by working with international organizations. In addition, he continues to work hard to secure and to cultivate domestic assistance resources.
Energy Efficiency Investments:

Special Report
One of 2010's Hottest Sectors
I'm a data hog.
It helps me make decisions based on real historical occurrences by finding trends, patterns, and outliers.
When dealing with stocks, I use data to find price ranges so I can advise readers when to buy low and sell high. If you get good enough, you don't even really need to know that much about a company - some volume numbers and a historical price chart will do just fine.
My readers closed dozens of stocks like that last year. Of course, we also find undiscovered stocks based on intense research of emerging technologies, long-term energy trends, earnings analysis and so on... but I digress.
I also use data to make personal decisions, which I then extrapolate to real-world happenings. This also helps me make investment decisions.
At the start of this New Year, I have some fresh full-year data, and some interesting conclusions to share.
My Gasoline Use
Last year, I drove 12,707.5 miles. I used 871.69 gallons of gas. I got 14.58 miles per gallon (MPG).
I spent a total of $1,947.18 on gasoline, paying anywhere from $1.48 per gallon (in January) to $2.74 (in December). The price constantly rose all year, but the average I paid for gas in 2009 was $2.23.
Here's all that data again, compared with my numbers from 2008.
| Year | Total Spent | Average Price | Total Gallons | Total Miles | MPG |
| 2008 | $2,185.47 | $3.09 | 715.71 | 10611.3 | 14.83 |
| 2009 | $1,947.18 | $2.23 | 871.69 | 12707.5 | 14.58 |
The main takeaway here is that I used 155.98 more gallons of gas in 2009 than I did in 2008. But I spent $238.29 less.
I guess what I'm trying to say is, when it comes to gas use, we're pretty much at the mercy of the market, since prices can swing so drastically. I mean, the average price last year was $0.86 lower than two years ago.
As a country, we didn't have to do anything and we saved money. It's easy to see why you wouldn't want to by a new car just to save a few miles per gallon.
My car is paid off. Why would I pay $26,000 for a new one, even if my mileage doubled? So I could get 30 mpg and use just 423 gallons, paying $944.55 instead of $1,947.18?
I'd save $1,002 in gas costs, but I'd have to pick up a few-hundred-dollar monthly car payment. Plus, my gas costs would go right back to where they were when the price goes back to $3.50 per gallon.
No thanks.
My Home Energy Use
My home consumed a total of 10,834 kWh of electricity and 611 Therms of natural gas. I paid a total of $2,346.30 for those services.
But as you'll see in the chart below, I used 54% less electricity in December than I did in January, and 64% less natural gas. As a result, my bill was $145.62 versus $358.12. Check it out:
| Month | Electricity (kWh) | Gas (Therms) | Bill Total |
| January | 1303 | 114 | $358.12 |
| February | 1069 | 132 | $345.51 |
| March | 960 | 95 | $267.89 |
| April | 929 | 64 | $223.91 |
| May | 1161 | 41 | $224.72 |
| June | 611 | 26 | $97.53 |
| July | 705 | 21 | $112.23 |
| August | 702 | 14 | $105.44 |
| September | 925 | 16 | $126.37 |
| October | 1177 | 19 | $201.95 |
| November | 695 | 22 | $137.01 |
| December | 597 | 47 | $145.62 |
| Annual | 10834 kWh | 611 Therms | $2,346.30 |
Now, I did a few things to reduce my home energy consumption this year. That's the reason for the constant decline in my bill.
First of all, I signed up for my local utility's energy efficiency program, Baltimore Gas & Electric's Smart Energy Savers. At no cost to me, they came out and installed a smart switch, made by Honeywell, on my outside air-conditioning unit. This allowed them to cycle my unit during days of peak demand in the summer.
Joining this program also entitled me to an $18.75 credit on my bill for the summer months of June through September.
All this, and I haven't spent a penny.
Thanks to utility deregulation in Maryland, I also signed up for electric supply service from Washington Gas Energy Services. That allowed me to lock-in a competitive rate of $0.108 per kWh instead of the $0.12 per kWh (or more) that BGE was charging. I was also guaranteed 5% wind energy.
Finally, I took some personal efficiency steps. I installed a smart thermostat and programmed efficient settings; I installed CFLs; I bought a tube of caulk and sealed windows, doors, and cracks; and I put a space heater in the bedroom so I could set the heat lower at night.
All this set me back about $200. But as you can see, my bills in the second half of the year were half us much as bills prior, saving me hundreds of dollars. And that will continue for years.
And that's the point I'd like to make here: When it comes to efficiency, making small changes at home has a much greater net benefit than make big changes to your car.
The Fifth Fuel
This is why building energy efficiency is now being referred to as the fifth fuel - after coal, oil, gas, and uranium.
And it's spawning an industry worth at least hundreds of billions of dollars.
I spent $200 last year on energy efficiency... There are 120 million homes in the United States... That's $24 billion right there.
Think of the global scale.
And that's without mentioning commercial buildings, of which there are 5 million in the States. These will cost even more to retrofit - call it $5,000 apiece. That's another $25 billion.
And based on my little experiment, we know these investments will be made because the payoff is worth it, even before figuring in the massive government incentives now on the table.
It's already translating into great gains on the Street. Take a look at the 2009 performance of two efficient lighting companies, a saved energy aggregator, and smart meter provider:

Some of those companies crested 500% for the year... and only a fraction of buildings have begun to be retrofitted.
I expect this to be a major investment theme again this year. And all of those companies in the chart are still on the table.
But there's one company out there offering an energy efficiency solution that blows all others away. They make a tiny device that reduces energy waste throughout an entire building. We installed it here in the office and immediately saved about 50% per month on our utility bills.
And the stock trades for less than a dollar.
I'm still doing due diligence and putting my report together. But keep an eye out for it in the next week or so.
Call it like you see it,
Nick
24 June 2010
Pengumuman Peserta Didik Baru SMA N 1 Simo Tahun Pel. 2010/2011

WAKTU DAN TEMPAT PENDAFTARAN :
Hari/Tanggal : Rabu s.d Jum’at, 30 Juni s.d. 2 Juli 2010
Waktu Pendaftaran : Pukul :08.00 – 12.00 WIB
Pendaftaran ditutup : Jum’at ,Tanggal : 2 Juli 2010 pukul : 10.00 WIB
Tempat Pendaftaran : SMA Negeri 1 Simo
Selengkapnya>>
22 June 2010
Control the Heat with PowerPoint Mouse Overs
By Glenna Shaw
Most of us are familiar with mouse overs on web pages. You move your mouse over an object and something changes on the screen. However, most people don’t realize how easy it is to create this same effect in PowerPoint 2000 or higher. This article shows you how to take PowerPoint mouse overs to the extreme. You’ll create a slideshow that has a thermometer for the menu. You can move through the slideshow by sliding your mouse up and down the thermometer, raising and lowering the “heat”.
Begin by creating your main background page. Open PowerPoint and click ok for a new slideshow. On the toolbar, click View, Master, and Slide Master. Set up the color scheme by clicking on Format, Slide Color Scheme, click on the color scheme with the blue background, click on Apply To All. Change the fonts by clicking on Edit, Select All, to select all the text. Click on Format, Font and change the font to Arial, Regular. Click ok. While you still have all the text selected, use your mouse to decrease the text space on the left side. Move your mouse over the left side marker (one of the white squares) of the text box until it turns into a line with arrows on the left and right (not the cross with four arrows). Click and hold your left mouse button and move the left side of your text to create room for the thermometer menu. Click anywhere off the slide to deselect the text. You now have a slide with a blue background and Arial text. You also have room on the left side for your thermometer.

If you don’t have Autoshapes on the bottom toolbar, click on View, Toolbars, and Drawing. To create the thermometer, click on Autoshapes, Basic Shapes, and select Rounded Rectangle. Draw your Rounded Rectangle on the left side of the slide to create the body of the thermometer. Change the fill color of the rectangle to white. Click on Autoshapes, Basic Shapes, Oval. Draw your oval over the bottom of the rectangle to create the bulb of the thermometer. Change the fill color of the oval to red. Click on Autoshapes, Basic Shapes, Rectangle. Draw a rectangle to cover the space where the bulb meets the thermometer body. Change the rectangle fill color to red. Create lines on the thermometer by clicking on Autoshapes, Lines, and Line. Draw a line just above the top of the red rectangle. Change the line color to black. Click on Edit, Copy, Edit, and Paste to create another line and move it above the first line. Create one line for each slide of your presentation (we’ll use five for our example). To evenly space the lines, hold down the shift key and click on each line. Make sure you only select the lines. Click on Draw, Align or Distribute, and Distribute Vertically. Your lines should now be evenly spaced on the body of your thermometer.

Your final step on the Master Slide is to create your first mouse-over. Right click on the oval shape, click on Action Settings, Click the Mouse Over tab, Click on Hyperlink, Change Next Slide to Slide…, Slide 1, Click ok. Click ok again. Click Close on the small Master Window.

You’re now at your title slide. Click on Insert, New Slide. Repeat for the number of slides needed. We use five slides in the example, so we’ll have six slides. Go to Slide 2. Click on Autoshapes, Basic Shapes, Rectangle. Draw a rectangle to increase the temperature on the thermometer to the first line. Change the rectangle fill color to red. Repeat for each slide, increasing to the next line on the thermometer for each successive slide.

The final step (and trickiest) is creating your “invisible” mouse-over buttons.
Return to the first slide. Click on Draw, Basic Shapes, Rectangle. Draw a rectangle over the thermometer that goes from the top of the bulb to the top line of the thermometer. Do not change the rectangle fill color yet. Right click on this rectangle, click on Action Settings, Click the Mouse Over tab, Click on Hyperlink, Change Next Slide to Slide…, Slide 6 (or your last slide), Click ok. Click ok again. Create another rectangle that goes from the bottom of this rectangle to the next line down on the thermometer. Right click on this rectangle, click on Action Settings, Click the Mouse Over tab, Click on Hyperlink, Change Next Slide to Slide…, Slide 5 (or your next to last slide), Click ok. Click ok again. Repeat this step for each remaining slide, moving DOWN the thermometer and BACKWARDS through the slides as you go. It is important to go from top to bottom so the mouse-over buttons are in the proper order.

Select all the mouse-over buttons by holding down the shift key and clicking on each one from the bottom up. Click on Draw, Align or Distribute, and Align Bottom. Click on Draw, Group to make the next step easier. Click on Draw, Order, Bring to Front. Click on Edit, Copy. Click on Format, Autoshape, and change the fill color and line color to No Fill and No Line. Your mouse-over buttons will now be invisible. Click on Draw, Ungroup to separate the buttons again. Go to Slide 2. Click on Edit, Paste. If necessary, move the grouped object to the correct position. Click on Format, Autoshape, and change the fill color and line color to No Fill and No Line. Click on Draw, Ungroup. Go to Slide 3. Click on Edit, Paste. If necessary, move the grouped object to the correct position. Click on Format, Autoshape, and change the fill color and line color to No Fill and No Line. Click on Draw, Ungroup. Repeat for the remaining slides.

Save your presentation. Enter the desired titles and text on your slides. Save the presentation again.
When you run your slideshow, move your mouse up and down the thermometer. Your slideshow will automatically move back and forth among your slides to match the thermometer temperature.
Most of us are familiar with mouse overs on web pages. You move your mouse over an object and something changes on the screen. However, most people don’t realize how easy it is to create this same effect in PowerPoint 2000 or higher. This article shows you how to take PowerPoint mouse overs to the extreme. You’ll create a slideshow that has a thermometer for the menu. You can move through the slideshow by sliding your mouse up and down the thermometer, raising and lowering the “heat”.
Begin by creating your main background page. Open PowerPoint and click ok for a new slideshow. On the toolbar, click View, Master, and Slide Master. Set up the color scheme by clicking on Format, Slide Color Scheme, click on the color scheme with the blue background, click on Apply To All. Change the fonts by clicking on Edit, Select All, to select all the text. Click on Format, Font and change the font to Arial, Regular. Click ok. While you still have all the text selected, use your mouse to decrease the text space on the left side. Move your mouse over the left side marker (one of the white squares) of the text box until it turns into a line with arrows on the left and right (not the cross with four arrows). Click and hold your left mouse button and move the left side of your text to create room for the thermometer menu. Click anywhere off the slide to deselect the text. You now have a slide with a blue background and Arial text. You also have room on the left side for your thermometer.
If you don’t have Autoshapes on the bottom toolbar, click on View, Toolbars, and Drawing. To create the thermometer, click on Autoshapes, Basic Shapes, and select Rounded Rectangle. Draw your Rounded Rectangle on the left side of the slide to create the body of the thermometer. Change the fill color of the rectangle to white. Click on Autoshapes, Basic Shapes, Oval. Draw your oval over the bottom of the rectangle to create the bulb of the thermometer. Change the fill color of the oval to red. Click on Autoshapes, Basic Shapes, Rectangle. Draw a rectangle to cover the space where the bulb meets the thermometer body. Change the rectangle fill color to red. Create lines on the thermometer by clicking on Autoshapes, Lines, and Line. Draw a line just above the top of the red rectangle. Change the line color to black. Click on Edit, Copy, Edit, and Paste to create another line and move it above the first line. Create one line for each slide of your presentation (we’ll use five for our example). To evenly space the lines, hold down the shift key and click on each line. Make sure you only select the lines. Click on Draw, Align or Distribute, and Distribute Vertically. Your lines should now be evenly spaced on the body of your thermometer.
Your final step on the Master Slide is to create your first mouse-over. Right click on the oval shape, click on Action Settings, Click the Mouse Over tab, Click on Hyperlink, Change Next Slide to Slide…, Slide 1, Click ok. Click ok again. Click Close on the small Master Window.
You’re now at your title slide. Click on Insert, New Slide. Repeat for the number of slides needed. We use five slides in the example, so we’ll have six slides. Go to Slide 2. Click on Autoshapes, Basic Shapes, Rectangle. Draw a rectangle to increase the temperature on the thermometer to the first line. Change the rectangle fill color to red. Repeat for each slide, increasing to the next line on the thermometer for each successive slide.
The final step (and trickiest) is creating your “invisible” mouse-over buttons.
Return to the first slide. Click on Draw, Basic Shapes, Rectangle. Draw a rectangle over the thermometer that goes from the top of the bulb to the top line of the thermometer. Do not change the rectangle fill color yet. Right click on this rectangle, click on Action Settings, Click the Mouse Over tab, Click on Hyperlink, Change Next Slide to Slide…, Slide 6 (or your last slide), Click ok. Click ok again. Create another rectangle that goes from the bottom of this rectangle to the next line down on the thermometer. Right click on this rectangle, click on Action Settings, Click the Mouse Over tab, Click on Hyperlink, Change Next Slide to Slide…, Slide 5 (or your next to last slide), Click ok. Click ok again. Repeat this step for each remaining slide, moving DOWN the thermometer and BACKWARDS through the slides as you go. It is important to go from top to bottom so the mouse-over buttons are in the proper order.
Select all the mouse-over buttons by holding down the shift key and clicking on each one from the bottom up. Click on Draw, Align or Distribute, and Align Bottom. Click on Draw, Group to make the next step easier. Click on Draw, Order, Bring to Front. Click on Edit, Copy. Click on Format, Autoshape, and change the fill color and line color to No Fill and No Line. Your mouse-over buttons will now be invisible. Click on Draw, Ungroup to separate the buttons again. Go to Slide 2. Click on Edit, Paste. If necessary, move the grouped object to the correct position. Click on Format, Autoshape, and change the fill color and line color to No Fill and No Line. Click on Draw, Ungroup. Go to Slide 3. Click on Edit, Paste. If necessary, move the grouped object to the correct position. Click on Format, Autoshape, and change the fill color and line color to No Fill and No Line. Click on Draw, Ungroup. Repeat for the remaining slides.
Save your presentation. Enter the desired titles and text on your slides. Save the presentation again.
When you run your slideshow, move your mouse up and down the thermometer. Your slideshow will automatically move back and forth among your slides to match the thermometer temperature.
21 June 2010
Magnify an image
John Ringold e-mailed me asking how to enlarge part of an image that is encircled within an oval.
Here's a slide with a map on Long Island. The idea is to magnify the section inside the oval.
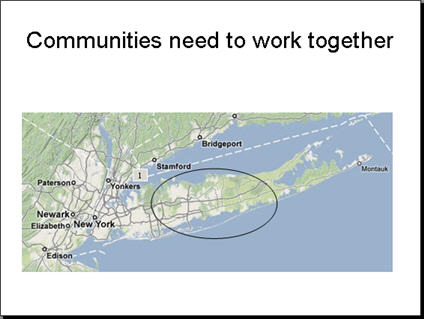
I came up with two techniques.
Contest! If you can come up with another technique, send it to me. The first person to send in one that I think does the job will receive a free copy of 101 Tips Every PowerPoint User Should Know or 7 Steps to Great Images — your choice. The deadline is Wednesday, September 17th.
Use the Grow/Shrink animation on an image-filled AutoShape
The first method is easy, but the resulting image is a little fuzzy. Follow these steps:
Insert your main image.
Select the image and duplicate it (Ctrl+D).
Display the Picture toolbar (right-click any toolbar and choose Picture). Choose the Crop button. (In 2007, click the Picture Tools Format tab and click the Crop button.) Crop the picture to the area that you want to show enlarged. Here you see the cropped picture in the upper-right corner of the slide.
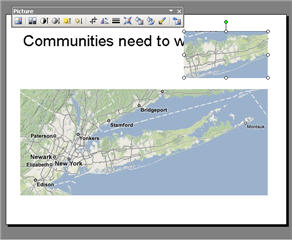
Right-click the picture and choose Save as Picture.
Delete the cropped picture; you don't need it on the slide any more.
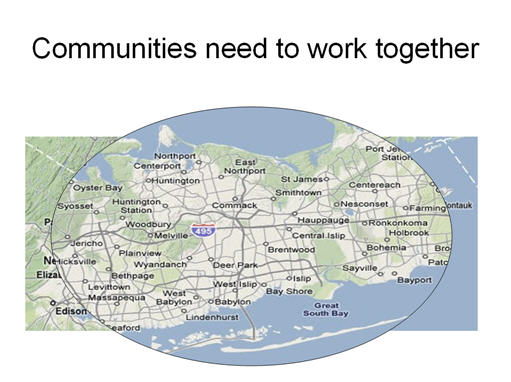
Insert an Oval from the Draw toolbar, dragging it to cover the area that you want to enlarge. (In 2007, insert it from the Home tab> Drawing group, Shapes.) Resize and move it as desired.
Right-click the oval and choose Format AutoShape (in 2007: Format Shape). On the Colors and Lines tab, click the Fill Color drop-down list and choose Fill Effects, then click the Picture tab. Click Select Picture and choose the image you saved. Click Insert. (In 2007, in the Fill category, choose Picture or Texture Fill. Click the File button, choose the image you saved, and click Insert.)
Click OK or Close to exit from any dialog boxes. The oval now contains the cropped image. If necessary, move and resize it so that the two images appear seamless and appear as one image with an oval over part of it.

With the filled oval selected, choose Slide Show> Custom Animation. (In 2007: go to Animations tab> Animations group> Custom Animation.)
Choose Add Effect> Emphasis> Grow/Shrink. You'll probably want to control the timing, so leave the Start to On Click. For the size, adjust as needed. Remember that you can click this item, and enter any value in the Custom text box. I used 200% to double the size of the image. Set the Speed as desired; I used the Fast setting.
Go into Slide Show view and click to watch the oval enlarge the image.
Watch the result (created with TechSmith Camtasia):

Use Zoom Animation on an enlarged image
To avoid a somewhat blurry image, you can start with the enlarged image. Follow these steps:
Insert your main image.
Insert an Oval from the Draw toolbar, dragging it to cover the area that you want to enlarge. (In 2007, insert it from the Home tab> Drawing group, Shapes.) Resize and move it as desired.
With the oval selected, choose Slide Show> Custom Animation. (In 2007: go to Animations tab> Animations group> Custom Animation.) Choose Add Effect> Exit> Disappear. The Start should be On Click if you want control over the timing. Instead, you can use With Previous to make it automatic.
Obtain another image that is enlarged the way you want it and insert it on top of the original image and the oval.
Display the Picture toolbar (right-click any toolbar and choose Picture). Choose the Crop button. (In 2007, click the Picture Tools Format tab and click the Crop button.) Crop the picture to the area that you want to show enlarged.
Right-click the picture and choose Save as Picture.
Insert another Oval from the Draw toolbar, dragging it to cover the area of the enlarged image that you want to display. (In 2007, insert it from the Home tab> Drawing group, Shapes.) Resize and move it as desired.
Delete the cropped picture; you don't need it on the slide any more.
Right-click the large oval and choose Format AutoShape (in 2007: Format Shape). On the Colors and Lines tab, click the Fill Color drop-down list and choose Fill Effects, then click the Picture tab. Click Select Picture and choose the larger image you saved. Click Insert. (In 2007, in the Fill category, choose Picture or Texture Fill. Click the File button, choose the image you saved, and click Insert.)
Click OK or Close to exit from any dialog boxes. The larger oval now contains the enlarged image. If necessary, move it so that it's centered over the smaller oval.
With the larger, filled oval selected, from the Custom Animation task pane, choose Add Effect> Entrance Zoom. The Start should be With Previous so that the animation starts as soon as the smaller oval disappears. I set the Speed to Fast.
Go into Slide Show view and click. The small oval disappears as the larger oval zooms in filled with the enlarged image.
Watch the animation:
Read more: http://www.ellenfinkelstein.com/powerpointtips/powerpoint_tip_magnify_image.html#ixzz0rYZBm8oE
Easily create a quiz in PowerPoint using Visual Basic for Applications
Easily create a quiz in PowerPoint using Visual Basic for Applications Did you know it's possible to create your own quiz slides in Microsoft PowerPoint using its macro functions and doing a little programming in Visual Basic for Applications (VBA)?
Quiz slides can be used to make presentations more engaging and fun. They work something like this: Each slide asks a question and displays answer choices. Quiz-takers (or audience members) then click on the answer they think is correct. If they answer correctly, a "congratulations" message appears and they automatically move on to the next slide. If they choose a wrong answer, they receive a "try again" message. The slideshow will not advance until they select the correct answer.
Some presenters may believe working with VBA and macros is too complicated, but it's easier than you might think. The VBA code is easy to understand and, for this article, I was able to use Visual Basic to create a 10-slide quiz in less than an hour.
STEP ONE
Create multiple-choice slides
The first step is to create the question slides. Within PowerPoint, start a new slide using the Title Only slide layout. Type the first question in the title-text placeholder.
To add the multiple-choice answers, go to the Draw toolbar and choose AUTOSHAPES » ACTION BUTTONS. Then choose the first action button, which is blank (aka Action Button: Custom). Now click on the slide and the new button will appear. Tip: If the Action Settings dialog box appears, choose Cancel. You will return to this box later in the tutorial.
Resize and position the button on the slide. For consistency, you should size the button to allow for the longest text answer.

Right-click on the button, choose Add Text from the subsequent menu, and type the first answer. Now select the button, right-click again, and choose Copy from the Edit menu. paste (CTRL+V) additional copies of the button graphic for the remaining answers you'll need on the slide.
When all the buttons are in place, select each individually and edit its text and color (right-click, then select the FORMAT AUTOSHAPE » COLORS AND LINES tab). You can also align the answer buttons on the slide using the Draw toolbar (DRAW » ALIGN OR DISTRIBUTE » ALIGN LEFT, then DRAW » ALIGN OR DISTRIBUTE » DISTRIBUTE VERTICALLY).
Repeat Step One to create each additional question slide. Tip: Within the Slide Sorter view, you can COPY (CTRL+C) the first question slide and PASTE it as many times as needed to quickly create the remaining question slides. Then return to Normal view to edit each slides' text.
On your final quiz slide, create an action button with the word End, and place it on the slide.
STEP TWO
Create macros
When the Q & A slides are done, you are ready to create the macros using PowerPoint's Visual Basic Editor. Before you begin, make sure that only the presentation you are currently working on is open.
From the TOOLS menu, choose MACRO » VISUAL BASIC EDITOR. The editor opens in a new window. The right side of the window will be gray. From the insert menu choose module and you'll see a blank white area where you can type a macro. We will create three macros.
We'll start with the code for the wrong answer. In the big blank space on the right, type the following three lines:
Sub Wrong()
MsgBox ("Sorry, that's not right. Please try again.")
End Sub
If you make a mistake, the editor will warn you, but the message may not be clear to you. Most often the mistake is a result of mistyping the code. You may have left out one of the quotation marks or the closing parenthesis at the end of a line. Double-check your typing and make adjustments until the Editor shows no warnings.
Next is the code for the right answer. At the end of the line reading "End Sub," press the enter key on your keyboard. This begins a new code group. Type the following four lines below your first code group:
Sub Right()
MsgBox ("That's right!")
SlideShowWindows(1).View.Next
End Sub
This code is similar to the previous macro, except for its "SlideShowWindows" line, which advances the quiz-taker to the next slide.
On the final slide, you don't want the slideshow to advance to the next slide because that starts the presentation all over again. Instead, you want viewers to use a button that exits the slideshow. So after the previous "End Sub," hit the ENTER key again and type your final piece of code:
Sub RightLast()
MsgBox ("Congratulations!")
End Sub

STEP THREE
Attach macros to buttons
To return to PowerPoint from the Visual Basic Editor, click on the View Microsoft PowerPoint icon (upper left-hand corner, under the FILE menu link). Leave the Visual Basic Editor open in the background. In PowerPoint, save the presentation, as this will save the new macros as well.
Go to your first question slide and select the button with the correct answer. Tip: Select the entire button, not just the text on the button.
Right-click on the button and choose Action Settings from the subsequent menu. The Action Settings dialog box will appear. Choose the Mouse Click tab, and from the "Action on click" area, check the "Run macro" radio button and select your new "Right" macro from the drop-down list. (Notice that all the macros on this list are named for the three pieces of code you created in the Visual Basic Editor.) Click OK.
Now select each of the wrong answers and follow the same procedure, except select the "Wrong" macro from the drop-down list.
Before going on to the other slides to assign the proper macros, try out the buttons on the first slide. Go into Slide Show view (SLIDE SHOW » VIEW SHOW). Click on a wrong answer. A text-message box should pop up indicating you have chosen the wrong answer. Click OK to close the box. Check the other wrong answers on the slide to make sure they also work. Finally, select the correct answer. This time, the text-message box should indicate you have chosen the right answer. Click OK and the slideshow will automatically advance to the next slide.
With the first slide working properly, edit the rest of the presentation, attaching the appropriate macros to the buttons. On the last slide, assign the correct answer to the "RightLast" macro so that quiz-takers stay on the last slide.
Remember the "End" button you created on this final slide? Right-click on that button and choose Action Settings. In the Action Settings dialog box, choose the "Hyperlink to" option and choose End Show from the drop-down list. Click OK. Quiz-takers can use this button when they're finished answering all the questions.
Once you have assigned macros to all of the action buttons, save the PowerPoint file.
STEP FOUR
The final setup
Finally, to prevent the quiz-takers from clicking through without answering all the questions, choose SLIDE SHOW » SET UP SHOW. In the Set Up Show dialog box choose the "Browsed at a kiosk (full screen)" option under the "Show type" area. Click OK. With this setting, the only way someone can get out of the presentation is to use the ESCAPE key.

Now, go into Slide Show mode and try your quiz, making sure all wrong answers and right answers use the proper macro. That wasn't so difficult, was it?
Being able to set up a VBA quiz opens up many other presentation possibilities. If you're interested in pursuing the use of macros in PowerPoint, I highly recommend the "Making PowerPoint Interactive" area of the State of Tasmania (Australia) Department of Education's Web site at www.education.tas.gov.au/itproject/ppt_vba. The explanations are clear and simple, and you'll be surprised what you can accomplish in a short time. For advanced options, try David Marcovitz' site at www.loyola.edu/education/powerfulpowerpoint. It has lots of quiz examples you can use by simply substituting questions and answers. You can also buy Marcovitz' book from the site, Powerful PowerPoint for Educators: Using Visual Basic for Application to Make PowerPoint Interactive.
Read more: http://www.ellenfinkelstein.com/powerpoint_tip_create_quiz_with_vba.html#ixzz0rYQoWe5w
Quiz slides can be used to make presentations more engaging and fun. They work something like this: Each slide asks a question and displays answer choices. Quiz-takers (or audience members) then click on the answer they think is correct. If they answer correctly, a "congratulations" message appears and they automatically move on to the next slide. If they choose a wrong answer, they receive a "try again" message. The slideshow will not advance until they select the correct answer.
Some presenters may believe working with VBA and macros is too complicated, but it's easier than you might think. The VBA code is easy to understand and, for this article, I was able to use Visual Basic to create a 10-slide quiz in less than an hour.
STEP ONE
Create multiple-choice slides
The first step is to create the question slides. Within PowerPoint, start a new slide using the Title Only slide layout. Type the first question in the title-text placeholder.
To add the multiple-choice answers, go to the Draw toolbar and choose AUTOSHAPES » ACTION BUTTONS. Then choose the first action button, which is blank (aka Action Button: Custom). Now click on the slide and the new button will appear. Tip: If the Action Settings dialog box appears, choose Cancel. You will return to this box later in the tutorial.
Resize and position the button on the slide. For consistency, you should size the button to allow for the longest text answer.
Right-click on the button, choose Add Text from the subsequent menu, and type the first answer. Now select the button, right-click again, and choose Copy from the Edit menu. paste (CTRL+V) additional copies of the button graphic for the remaining answers you'll need on the slide.
When all the buttons are in place, select each individually and edit its text and color (right-click, then select the FORMAT AUTOSHAPE » COLORS AND LINES tab). You can also align the answer buttons on the slide using the Draw toolbar (DRAW » ALIGN OR DISTRIBUTE » ALIGN LEFT, then DRAW » ALIGN OR DISTRIBUTE » DISTRIBUTE VERTICALLY).
Repeat Step One to create each additional question slide. Tip: Within the Slide Sorter view, you can COPY (CTRL+C) the first question slide and PASTE it as many times as needed to quickly create the remaining question slides. Then return to Normal view to edit each slides' text.
On your final quiz slide, create an action button with the word End, and place it on the slide.
STEP TWO
Create macros
When the Q & A slides are done, you are ready to create the macros using PowerPoint's Visual Basic Editor. Before you begin, make sure that only the presentation you are currently working on is open.
From the TOOLS menu, choose MACRO » VISUAL BASIC EDITOR. The editor opens in a new window. The right side of the window will be gray. From the insert menu choose module and you'll see a blank white area where you can type a macro. We will create three macros.
We'll start with the code for the wrong answer. In the big blank space on the right, type the following three lines:
Sub Wrong()
MsgBox ("Sorry, that's not right. Please try again.")
End Sub
If you make a mistake, the editor will warn you, but the message may not be clear to you. Most often the mistake is a result of mistyping the code. You may have left out one of the quotation marks or the closing parenthesis at the end of a line. Double-check your typing and make adjustments until the Editor shows no warnings.
Next is the code for the right answer. At the end of the line reading "End Sub," press the enter key on your keyboard. This begins a new code group. Type the following four lines below your first code group:
Sub Right()
MsgBox ("That's right!")
SlideShowWindows(1).View.Next
End Sub
This code is similar to the previous macro, except for its "SlideShowWindows" line, which advances the quiz-taker to the next slide.
On the final slide, you don't want the slideshow to advance to the next slide because that starts the presentation all over again. Instead, you want viewers to use a button that exits the slideshow. So after the previous "End Sub," hit the ENTER key again and type your final piece of code:
Sub RightLast()
MsgBox ("Congratulations!")
End Sub
STEP THREE
Attach macros to buttons
To return to PowerPoint from the Visual Basic Editor, click on the View Microsoft PowerPoint icon (upper left-hand corner, under the FILE menu link). Leave the Visual Basic Editor open in the background. In PowerPoint, save the presentation, as this will save the new macros as well.
Go to your first question slide and select the button with the correct answer. Tip: Select the entire button, not just the text on the button.
Right-click on the button and choose Action Settings from the subsequent menu. The Action Settings dialog box will appear. Choose the Mouse Click tab, and from the "Action on click" area, check the "Run macro" radio button and select your new "Right" macro from the drop-down list. (Notice that all the macros on this list are named for the three pieces of code you created in the Visual Basic Editor.) Click OK.
Now select each of the wrong answers and follow the same procedure, except select the "Wrong" macro from the drop-down list.
Before going on to the other slides to assign the proper macros, try out the buttons on the first slide. Go into Slide Show view (SLIDE SHOW » VIEW SHOW). Click on a wrong answer. A text-message box should pop up indicating you have chosen the wrong answer. Click OK to close the box. Check the other wrong answers on the slide to make sure they also work. Finally, select the correct answer. This time, the text-message box should indicate you have chosen the right answer. Click OK and the slideshow will automatically advance to the next slide.
With the first slide working properly, edit the rest of the presentation, attaching the appropriate macros to the buttons. On the last slide, assign the correct answer to the "RightLast" macro so that quiz-takers stay on the last slide.
Remember the "End" button you created on this final slide? Right-click on that button and choose Action Settings. In the Action Settings dialog box, choose the "Hyperlink to" option and choose End Show from the drop-down list. Click OK. Quiz-takers can use this button when they're finished answering all the questions.
Once you have assigned macros to all of the action buttons, save the PowerPoint file.
STEP FOUR
The final setup
Finally, to prevent the quiz-takers from clicking through without answering all the questions, choose SLIDE SHOW » SET UP SHOW. In the Set Up Show dialog box choose the "Browsed at a kiosk (full screen)" option under the "Show type" area. Click OK. With this setting, the only way someone can get out of the presentation is to use the ESCAPE key.
Now, go into Slide Show mode and try your quiz, making sure all wrong answers and right answers use the proper macro. That wasn't so difficult, was it?
Being able to set up a VBA quiz opens up many other presentation possibilities. If you're interested in pursuing the use of macros in PowerPoint, I highly recommend the "Making PowerPoint Interactive" area of the State of Tasmania (Australia) Department of Education's Web site at www.education.tas.gov.au/itproject/ppt_vba. The explanations are clear and simple, and you'll be surprised what you can accomplish in a short time. For advanced options, try David Marcovitz' site at www.loyola.edu/education/powerfulpowerpoint. It has lots of quiz examples you can use by simply substituting questions and answers. You can also buy Marcovitz' book from the site, Powerful PowerPoint for Educators: Using Visual Basic for Application to Make PowerPoint Interactive.
Read more: http://www.ellenfinkelstein.com/powerpoint_tip_create_quiz_with_vba.html#ixzz0rYQoWe5w
Energy Issues
Sources of Greenhouse Gas Emissions
What are the Issues?
Source :http://www.willyoujoinus.com/energy.issues/energychallengesandopportunities/climatechangeandgreenhousegasemissions/sourcesofgreenhousegasemissions/
While the majority of greenhouse gases (GHGs) are a result of producing and consuming energy, they are also tied to agriculture, land use change, and forestry activities. The majority of GHGs associated with energy production and use occur during fuel combustion that supports electricity generation, transportation, and industrial processes.1 The following discussion provides a synopsis specifically focused on GHG emissions that are a result of the energy supply chain — from resource extraction to the primary end uses of energy.

GHGs From Energy 2

World Primary Energy Consumption & GHG Emissions (by fuel) 3

GHGs from Electricity and Heat 4
What are the Challenges?
Fugitive Emissions & Natural Gas Flaring
When producing oil, there are often large quantities of "associated" gas that must be separated for handling purposes. While this natural gas is sold where an infrastructure and market exists, associated natural gas may be flared (burned) or vented (released) into the atmosphere when these alternatives are not available. The venting of unprocessed gas releases methane into the atmosphere, which is a greenhouse gas. Flaring causes emissions of other greenhouse gases, including carbon dioxide, carbon monoxide, nitrogen oxides, and sulfur oxides. Other parts of the oil and gas value chain (such as refineries and pipelines) also can generate fugitive emissions through leaks, losses, and accidents.5
Industry and company partnerships with governments of oil producing countries are collaborating on solutions that are substantially reducing gas flaring.6 These solutions include creating economic incentives to produce and deliver gas to markets and re-injecting associated gas into oil reservoirs, which enhances oil production, stores the otherwise flared gas and reduces GHG emissions. In addition, businesses, governments, investors and scientists are working together to find ways to increase carbon capture and storage at gas fields and coal mines.
Emissions from Electricity Generation
Power generation plants convert energy inputs (such as coal, natural gas, and oil) into electricity for residential, commercial, and industrial use. Both in the United States and worldwide, the generation of electricity and heating is the single largest source of CO2 emissions.7
Coal remains an important and growing source for energy supply and accounts for a dominant portion (73%) of the CO2 emissions from the electricity generation sector.8
Potential climate change solutions that would reduce emissions will need to take into account the particular characteristics of electricity generation, such as:
More than forty percent of electricity demand is for the benefit of commercial and residential buildings, thirty five percent is for industry, and the remainder is for energy processing (refining) and energy transmission, including losses.9
The United States, China, and the EU are by far the largest emitters (in absolute terms) in this sector.10
Seventy percent of US electricity comes from fossil fuels such as coal, oil and natural gas.11
At the global level, emissions from this sector are the fastest growing. In order to address this challenge, stakeholders are working to reduce reliance upon coal combustion and to encourage the use of alternative resources for electricity generation such as nuclear, natural gas, geothermal and renewable technologies. (The Energy Portfolio). By 2015, natural-gas-fired plants, which are cleaner burning than coal, are expected to account for 25 percent of electricity generation in the United States, with investments in such plants currently underway.12 Another way to reduce the emissions from energy production is to invest in energy efficiency at production facilities: technologies such as advanced combined cycle gas turbines reduce the losses that arise in generating energy.13
Emissions from Industry
Industrial facilities, including those for chemical, petrochemical, cement, steel, and aluminum production, are large consumers of energy, accounting for a third of global industrial energy use and 21% of world GHG CO2 emissions.14 Through voluntary and regulatory initiatives, industrial users are managing their climate change impacts and are implementing a range of efficiency measures as well as technology innovations to curtail their energy footprint.
When considering solutions for reducing emissions from industry, it is important to consider the particular characteristics of this type of energy use, including:
Industrial uses of energy are diverse, but fossil fuel combustion, electricity and heat contribute the majority of GHGs (see figure below).
The majority of emissions from industry come from developing countries with large scale energy intensive industries, with China having the largest share.15
Emissions from industry as a relative share of overall national emissions have declined since 1990 in the United States, the EU-25, Mexico, Russia and Australia.16

GHGs from Industry 17

GHGs from Transportation 18

World Energy Related Carbon Dioxide Emissions by Fuel Type 1990-2030 19

Global Billion Tons of Carbon Emissions per Year 20
Emissions from Transportation
Road transport is the dominant contributor of GHG emissions in the transportation sector (see figure below), which is second to electricity generation in terms of overall GHG contributions. Some important characteristics of this segment include:
Petroleum dominates this sector in terms of both energy demand and emissions.
The OECD countries constitute over 50% of worldwide emissions from transportation fuels.21
Transportation is a fast growing source of emissions in several countries. In China, for example, the number of cars more than doubled between 2000 and 2006 and substantial growth in vehicle sales and demand for fuel are anticipated, which will contribute to the country’s continued growth of emissions (which is largely driven by the expansion of the power sector).22
National policies which focus on improving engine efficiency and providing incentives and mechanisms to reduce demand (such as incentives for using public transportation or high-occupancy vehicle systems) could provide a long-term pathway for reducing emissions from the transportation sector.23 In addition, technology advances including electric hybrid vehicles and plug in electric hybrids, advanced diesel technology, and hydrogen power offer emerging platforms for reducing GHGs in this sector. Initiatives that address engine efficiency, especially consumer education programs, offer some of the most readily available GHG reduction strategies. 24
What are the Solutions?
Scientists contend that it is possible to reduce, delay or avoid many climate change impacts through mitigation efforts that stabilize the atmospheric concentrations of greenhouse gases.25
To achieve this stabilization, the consensus among climate scientists is that worldwide emissions of greenhouse gases need to start a long-term decline within the next decade or two and realize reductions of about 50 to 80 percent by 2050 (from 1990 levels).26 Most scientists agree that there is no single solution - the deployment of a broad portfolio of different strategies and technologies will be necessary to stabilize carbon emissions by 2050.27 (The Energy Portfolio). Our global challenge is to develop the right mix of solutions that achieve these stabilization goals while continuing to support economic growth and development. Periodic "checkpoints" that assess the environmental, social and economic impacts of solutions will help us to know whether the right results are being achieved.28
Robert Socolow and his colleagues at Princeton developed a theoretical approach to reducing GHGs based on "wedges" of activity. Each of the seven wedges illustrated below represents an application of current technology that would reduce carbon emissions by 1 billion metric tons per year.29
The following sections detail different sets of climate change solutions that could be pursued, including: energy conservation and efficiency; cleaner emerging energies, and; energy policies, markets and incentives.
Introduction to Climate Change & Greenhouse Gas Emissions Energy Conservation & Efficienc
A New Way to Turn Plastic Into Fuel?
By MATTHEW L. WALD
Source : http://green.blogs.nytimes.com/2009/09/16/a-new-way-to-turn-plastic-into-fuel/
 Envion Envion, a Washington, D.C., start-up, aims to turn plastics into fuel — with minimal mess.
Entrepreneurs have been trying for years to turn low-value wastes into high-value products. Waste plastic is among the lowest in value, and gasoline or diesel fuel the highest, but machines that carry out that conversion usually consume a lot of energy and get gummed-up by leftover materialthat they cannot convert.
Now a company in Washington, D.C., is trying out a new way — heating the plastic to a very carefully controlled temperature range, with infrared energy.
Source : http://green.blogs.nytimes.com/2009/09/16/a-new-way-to-turn-plastic-into-fuel/
Envion Envion, a Washington, D.C., start-up, aims to turn plastics into fuel — with minimal mess. Entrepreneurs have been trying for years to turn low-value wastes into high-value products. Waste plastic is among the lowest in value, and gasoline or diesel fuel the highest, but machines that carry out that conversion usually consume a lot of energy and get gummed-up by leftover materialthat they cannot convert.
Now a company in Washington, D.C., is trying out a new way — heating the plastic to a very carefully controlled temperature range, with infrared energy.
Spreader of Hot Sex Video "Ariel-Luna Maya-Cut Tari" Already Known

VIVAnews - Information Technology observer, Muhammad Salahuddien Manggalanny have pocketed a spreader perpetrator video. The actors are very professional, said one expert who asked police to probe the case of porn videos that is associated with Ariel "Peterpan", Luna Maya, and Cut Tari.
"We already have several lists that can be followed up by the police. More than one. But these groups, can set people or a profession," he said in a conversation with VIVAnews Salahuddien, Wednesday, June 16, 2010.
According to him, it could be perpetrators are a very expert or mastermind who can also hire these professional people. "To be sure, this is not normal distribution," he said.
18 June 2010
Sepulun Tipe Guru
 Belajar di kelas itu sebenarnya sungguh menyenangkan. Tapi bagaimana mau senang kalau gurunya tidak “sreg” di mata kita? Itulah namanya belajar di dalam kelas. Semuanya butuh kerja keras. Kalau mau senang-senang yah tinggal pergi ke tempat hiburan.
Dari pengamatan saya selama belajar di dalam kelas ada 10 macam tipe guru diantaranya.
1. Tipe Pengasih Lagi Maha Penyayang
Guru ini selalu memberikan kisi-kisi sebelum berlangsungnya UTS dan US. Kisi-kisinya bukan sembarang kisi-kisi. Kisi-kisi ini hampir 100% akurat persis dengan soal ujian. Sudah pasti yang mempelajari kisi-kisi, ujiannya akan dapat 100.
2. Tipe The Hulk
Nah ini Guru pas menit-menit pertama masuk ngajarnya enak….santai… Tapi setelah 15 menit kemudian dia berubah menjadi MONSTER. Perangainya berubah. Mendadak emosian, marah-marah ke para siswa. Apalagi pas dia lagi asik-asik ngajar ada siswa yang terlambat, maka tamatlah nasib siswa tersebut.
17 June 2010
Amonia Borane - Masa Depan Media Penyimpan Hidrogen
 |  |  |
| Sumber : energiterbarukan.net | ||||
| Thursday, 17 June 2010 | ||||
| ||||

Batasi Kecepatan Berkendara Maksimal 80 km/jam, Capai Penurunan Emisi Karbon Dioksida Sebesar 30%
Rabu, 09 Juni 2010 - 01:07:57 
Sektor transportasi merupakan salah satu penyumbang terbesar emisi karbon dioksida. Jutaan mesin yang berjalan hilir mudik di jalanan menggunakan bahan bakar fosil, diesel dan bensin.
Hingga kini berbagai usaha telah dilakukan untuk mengurangi emisi karbon dari sektor transportasi, mulai dari alternatif bahan bakar organik, perbaikan efisiensi sistem pembakaran dalam ruang bakar, hingga perbaikan aerodinamika bodi kendaraan dan peningkatan unjuk kerja roda.
Semua langkah tersebut di atas merupakan usaha secara teknis untuk mengurangi emisi CO2 yang ditimbulkan kendaraan. Sebagai pengendara ada sebuah cara sederhana yang menurut hasil riset perusahaan konsultan di Belanda bisa dilakukan untuk mengurangi emisi kendaraan dengan hanya membatasi kecepatan maksimum 80 kilometer per jam.
CE Delft melaporkan bahwa kecepatan maksimum 80 kilometer per jam akan mengurangi emisi CO2 hingga 30%. Studi yang dilakukan perusahaan konsultan terkemuka di Belanda tersebut menjelaskan bahwa jika batasan kecepatan maksimum dilakukan menyeluruh di seluruh Belanda dan dilakukan dengan ketat, maka angka 30% tersebut akan tercapai. Sementara jika pelaksanaannya tidak dilakukan dengan ketat, maka pengurangan emisi hanya akan sebesar 8 - 21%.
Dalam hasil riset tersebut juga dijelaskan bahwa riset tersebut didesain khusus untuk Belanda. Artinya jika riset tersebut dilakukan di negara-negara lain dengan metode yang sama, maka akan memberikan hasil yang berbeda. Faktor yang mempengaruhinya adalah batas kecepatan yang berlaku dan jenis kendaraan yang banyak digunakan.
Selain itu juga didapatkan temuan yang menarik dari riset tersebut. Batasan kecepatan yang relatif rendah tersebut akan menambah waktu yang dibutuhkan untuk sebuah perjalanan dengan jarak yang sama. Hal tersebut sedikit demi sedikit akan ''memaksa'' banyak pemilik kendaraan pribadi beralih ke transportasi publik.
Riset tersebut juga memprediksi bahwa semakin lama orang akan memilih untuk lebih dekat dengan tempat belanja dan kerjanya, yang berarti juga mengurangi jarak tempuh. Dampak positif lain dari pembatasan kecepatan adalah menurunnya polusi udara dan suara, serta meningkatnya keselamatan di jalan raya.
autobloggreen
Bottled Water Versus Tap Water, Which Is Better
Studies Show That Tap Water Is As Good Or Better Than Bottled Water

Many people spend substantial amounts of money each year on bottled water because they believe that it is cleaner or safer than tap water.

Studies conducted in the U.S. show that tap water is often cleaner and safer than bottled water. The Natural Resources Defense Council (NRDC) conducted a study evaluating contaminants in bottled water. They tested 103 brands of bottled water and found that one-third contained contaminants, and one even exceeded allowable limits ("Bottled Water: Pure Drink or Pure Hype?" NRDC March 1999.).
The Scary Truth About Bottled Water
The U.S. Food and Drug Administration (FDA) is responsible for ensuring that many products people purchase for consumption are safe. However, companies who package and sell their bottled water within the same state, which constitutes 60-70 percent of all bottled water consumed in the U.S., are exempt from inspection by the FDA. Those that are overseen by the FDA are actually not tested as stringently as city tap water is - bottled water is not required to be disinfected, filtered or tested for contaminants such as viruses. Bottled water is tested for bacteria once per week and synthetic chemicals once per year, in contrast to tap water which is tested weekly and quarterly for bacteria and chemicals, respectively. Even fecal traces are allowable in bottled water, provided they're not too high ("Bottled Water: Pure Drink or Pure Hype?" NRDC March 1999.).
Labeling of bottled water is meant to inspire images of crisp clean flowing mountain spring water, bottled directly and sold straight to the buyer. Surprisingly, anywhere from 25-40 percent of bottled water sold in the U.S. is simply tap water that has been put in a bottle, labeled attractively, and had a price tag attached. It was discovered that in one case "pure glacier water" was indeed bottled public city water, and one labeled "spring water" actually came from a source near an industrial parking lot and hazardous waste site!
Recycled Cigarette Butts Will Lower Energy Use & Stop Corrosion

Recycling cigarette butts can lower energy use in homes and keep steel pipes, used in the oil industry, from rusting and corroding.
By now most people have heard about and realize the serious and harmful effects that cigarettes and cigarette smoke cause but what most people do not realize is that the discarded cigarette butts contribute to landfill costs. As well, cigarette butts contain harmful highly toxic materials and do degrade in a manner that lasts for years.
There is a light at the end of the tunnel however as many companies are working on ways to recycle cigarettes butts and put them to good use. China’s scientists have developed ways to "extract chemicals from discarded cigarette butts in order to protect steel pipes from corrosion." A community in London believes that Igloo Environmental, a U.K.-based recycling company, has found a way to use recycled cigarette butts and turn them into insulation products.
Cigarette Butts Help Stop Corrosion
Chinese scientists have worked to find a way to get some good out of the number one littered item. With more than "4.5 trillion cigarette butts make[ing] their way into the environment each year" there was a need to do something and the Chinese saw a solution, according to Earth911.com.
Cigarette filters are made up of cellulose acetate and nine other chemicals including, of course, nicotine. Scientists were able to remove those different chemicals and use them to prevent corrosion on steel that is used in the oil industry. The effects were favorable. Helping keep steel from rusting is a "major ongoing cost for oil producers" and this research provided by Chinese scientists will prove extremely useful for keeping corrosion and expenses down.
Cigarette Butts Help Lower Home Energy Use
The Igloo Environment recycling company realized that by recycling cigarette butts, they could lower the cost of city expenses associated with liter and landfills. The need to do something about 30,000 tons of littered cigarette butts a year was great and the Igloo Environment Company focused on turning fiber waste streams into useful insulation products, according to Earth911.com. The cigarettes will have to go through a sterilization and recycling process to remove the toxins. They then will be "broken down into their paper and fibrous material components and compacted into insulation "pillows." The insulation pillows are used in homes to decrease energy consumption associated with heat loss." This is another step in protecting our environment from "toxins associated with rainwater runoff and landfilling, while providing a 100 percent recycled insulation product for home use."
15 June 2010
Tugas Kimia
Daftar Nilai Tugas Kimia
Mohon maaf, karena kesibukan tugas dinas, email yang masuk belum dapat ditampilkan. Bagi siswa yang telah mengirimkan email tugas dan belum tercantum di bawah ini, diharapkan sabar sejenak.
| No. | Nama | Kelas | Nilai | Tgl. Koreksi |
| 1 | Junita Arnawati | X-1 | B | 15/06/2010 |
| 2 | Junita Arnawati | X-1 | A | 15/06/2010 |
| 3 | Kunti Nur Wulandari | X-1 | A | 15/06/2010 |
| 4 | Hesti S. | X-1 | B+ | 15/06/2010 |
| 5 | Adil Tanedha | X-4 | B+ | 15/06/2010 |
| 6 |
06 June 2010
BINTEK TRAINER MASTER PEMBELAJARAN BERBASIS TIK

Dinas Pendidikan P dan K Provinsi Jawa Tengah pada bulan Juni 2010 menyelenggarakan Bintek Pengembangan Trainer Master Pembelajaran Berbasis TIK sebanyak 5 angkatan.
Saya mewakili Kabupaten Boyolali merupakan peserta angkatan II yang berlangsung mulai tgl. 10 sd. 12 Juni 2010.
Pelaksanaan bintek ini bertempat di BPTIKP Jawa Tengah, dengan materi antara lain :
- Pengembangan RPP Berbasis TIK
- Peranan Internet dalam Pembelajaran
- Pembuatan Multimedia Pembelajaran Interaktif
- Open Source, dll.
Subscribe to:
Posts (Atom)